IELTS WRITING PART 1 – GRAPHS
· RMA
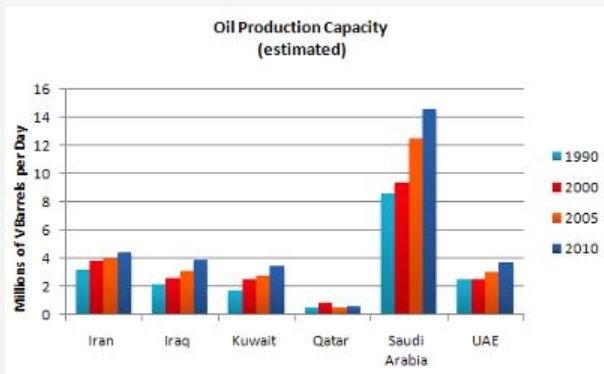
The bar chart (1) the amount of oil produced in 6 countries between 1990 and 2010, (2) in millions of barrels per day.
Correct!
Wrong!
Choose the best words...
The bar chart illustrates the (1) amount of oil produced in 6 countries between 1990 and 2010, (2) in millions of barrels per day.
Correct!
Wrong!
Choose the correct words...
Overall, oil production capacity (3) to increase during this 20-year period.
Correct!
Wrong!
Choose the correct words...
The figures for Saudi Arabia were (4) higher than in the other countries, while production was lowest in Qatar.
Correct!
Wrong!
From 1990 to 2010, there was a significant (5) in oil production in Saudi Arabia. In 1990, just over 8 million barrels per day were produced and this (6) steadily, reaching a (7) of over 14 million barrels per day in 2010.
Correct!
Wrong!
Choose the correct answer...
From 1990 to 2010, there was a significant (5) in oil production in Saudi Arabia. In 1990, just over 8 million barrels per day were produced and this (6) steadily, reaching a (7) of over 14 million barrels per day in 2010
Correct!
Wrong!
From 1990 to 2010, there was a significant (5) in oil production in Saudi Arabia. In 1990, just over 8 million barrels per day were produced and this (6) steadily, reaching (7) of over 14 million barrels per day in 2010
Correct!
Wrong!
(8), the smallest producer was Qatar.
Correct!
Wrong!
Choose the correct words...
(9) a slight increase in 2000, production in Qatar remained relatively stable at less than 1 million barrels per day.
Correct!
Wrong!
Choose the correct words...
The other countries (10) a slight rise in oil production over the period.
Correct!
Wrong!
Choose the correct words
The (11) figure for Iran in 1990 was over 3 million barrels per day, compared with around 2 million barrels in the other three countries.
Correct!
Wrong!
Choose the correct words...
(12) production did not increase in 2000 in the UAE, the amount of oil produced peaked in 2010 in Iran at over 4 million barrels and at almost 4 million barrels in Iraq, Kuwait and the UAE.
Correct!
Wrong!
Choose the correct answer...
Full Text :The bar chart illustrates the estimated amount of oil produced in 6 countries between 1990 and 2010, measured in millions of barrels per day. Overall, oil production capacity tended to increase during this 20-year period. The figures for Saudi Arabia were significantly higher than in the other countries, while production was lowest in Qatar. From 1990 to 2010, there was a significant increase in oil production in Saudi Arabia. In 1990, just over 8 million barrels per day were produced and this rose steadily, reaching a peak of over 14 million barrels per day in 2010. In contrast, the smallest producer was Qatar. Despite a slight increase in 2000, production in Qatar remained relatively stable at less than 1 million barrels per day. The other countries saw a slight rise in oil production over the period. The estimated figure for Iran in 1990 was over 3 million barrels per day, compared with around 2 million barrels in the other three countries. Although production did not increase in 2000 in the UAE, the amount of oil produced peaked in 2010 in Iran at over 4 million barrels and at almost 4 million barrels in Iraq, Kuwait and the UAE.
Correct!
Wrong!